Professional Version About Your Stock Courses
Master the Markets With Tedros Rezene.
Comprehensive Stock Trading Courses
Tedros Rezene offers a series of structured, high-impact stock trading courses designed for beginners, intermediate traders, and advanced market participants. Each course is built on clear strategies, practical examples, and real market applications helping students gain the confidence and skills needed to trade profitably.
Course 1: Introduction to Stock Trading
Perfect for beginners
Learn how the stock market works
Understand key concepts such as supply & demand, volume, and candlestick patterns
Discover how to read charts and identify market trends
Build a strong foundation for more advanced strategies
Course 2: Technical Analysis & Market Structure
For intermediate traders who want consistency
Master support/resistance, liquidity zones, and trend behavior
Learn how institutions move the market
Identify high-probability setups
Apply technical tools with precision
Course 3: Day Trading & Scalping Strategies
For fast paced, active traders
High-accuracy entry and exit strategies
Understanding volatility and market timing
Risk management for short-term trading
Live market examples and practical tips
Course 4: Swing & Long Term Investment Strategies
For traders aiming to grow wealth steadily
Multi day setup identification
Portfolio building and diversification
Combining fundamentals with technical analysis
How to position yourself for long term success
Why Learn From Tedros Rezene?
Over 9 years of active trading experience
Daily analysis shared freely with subscribers
Clear, practical strategies with a focus on accuracy
A strong goal: help traders reach over 90% win-rate consistency
Courses designed to be completed efficiently all analysis done within 30 minutes
Who Are These Courses For?
Beginners who want a clear pathway into the stock market
Traders who want more consistent results
Investors seeking smarter strategies
Anyone who wants a mentor with real-world experience
Join Today and Elevate Your Trading
Whether you’re starting from zero or refining advanced skills, these courses provide everything you need to trade with confidence and clarity.
If you'd like, I can also create.
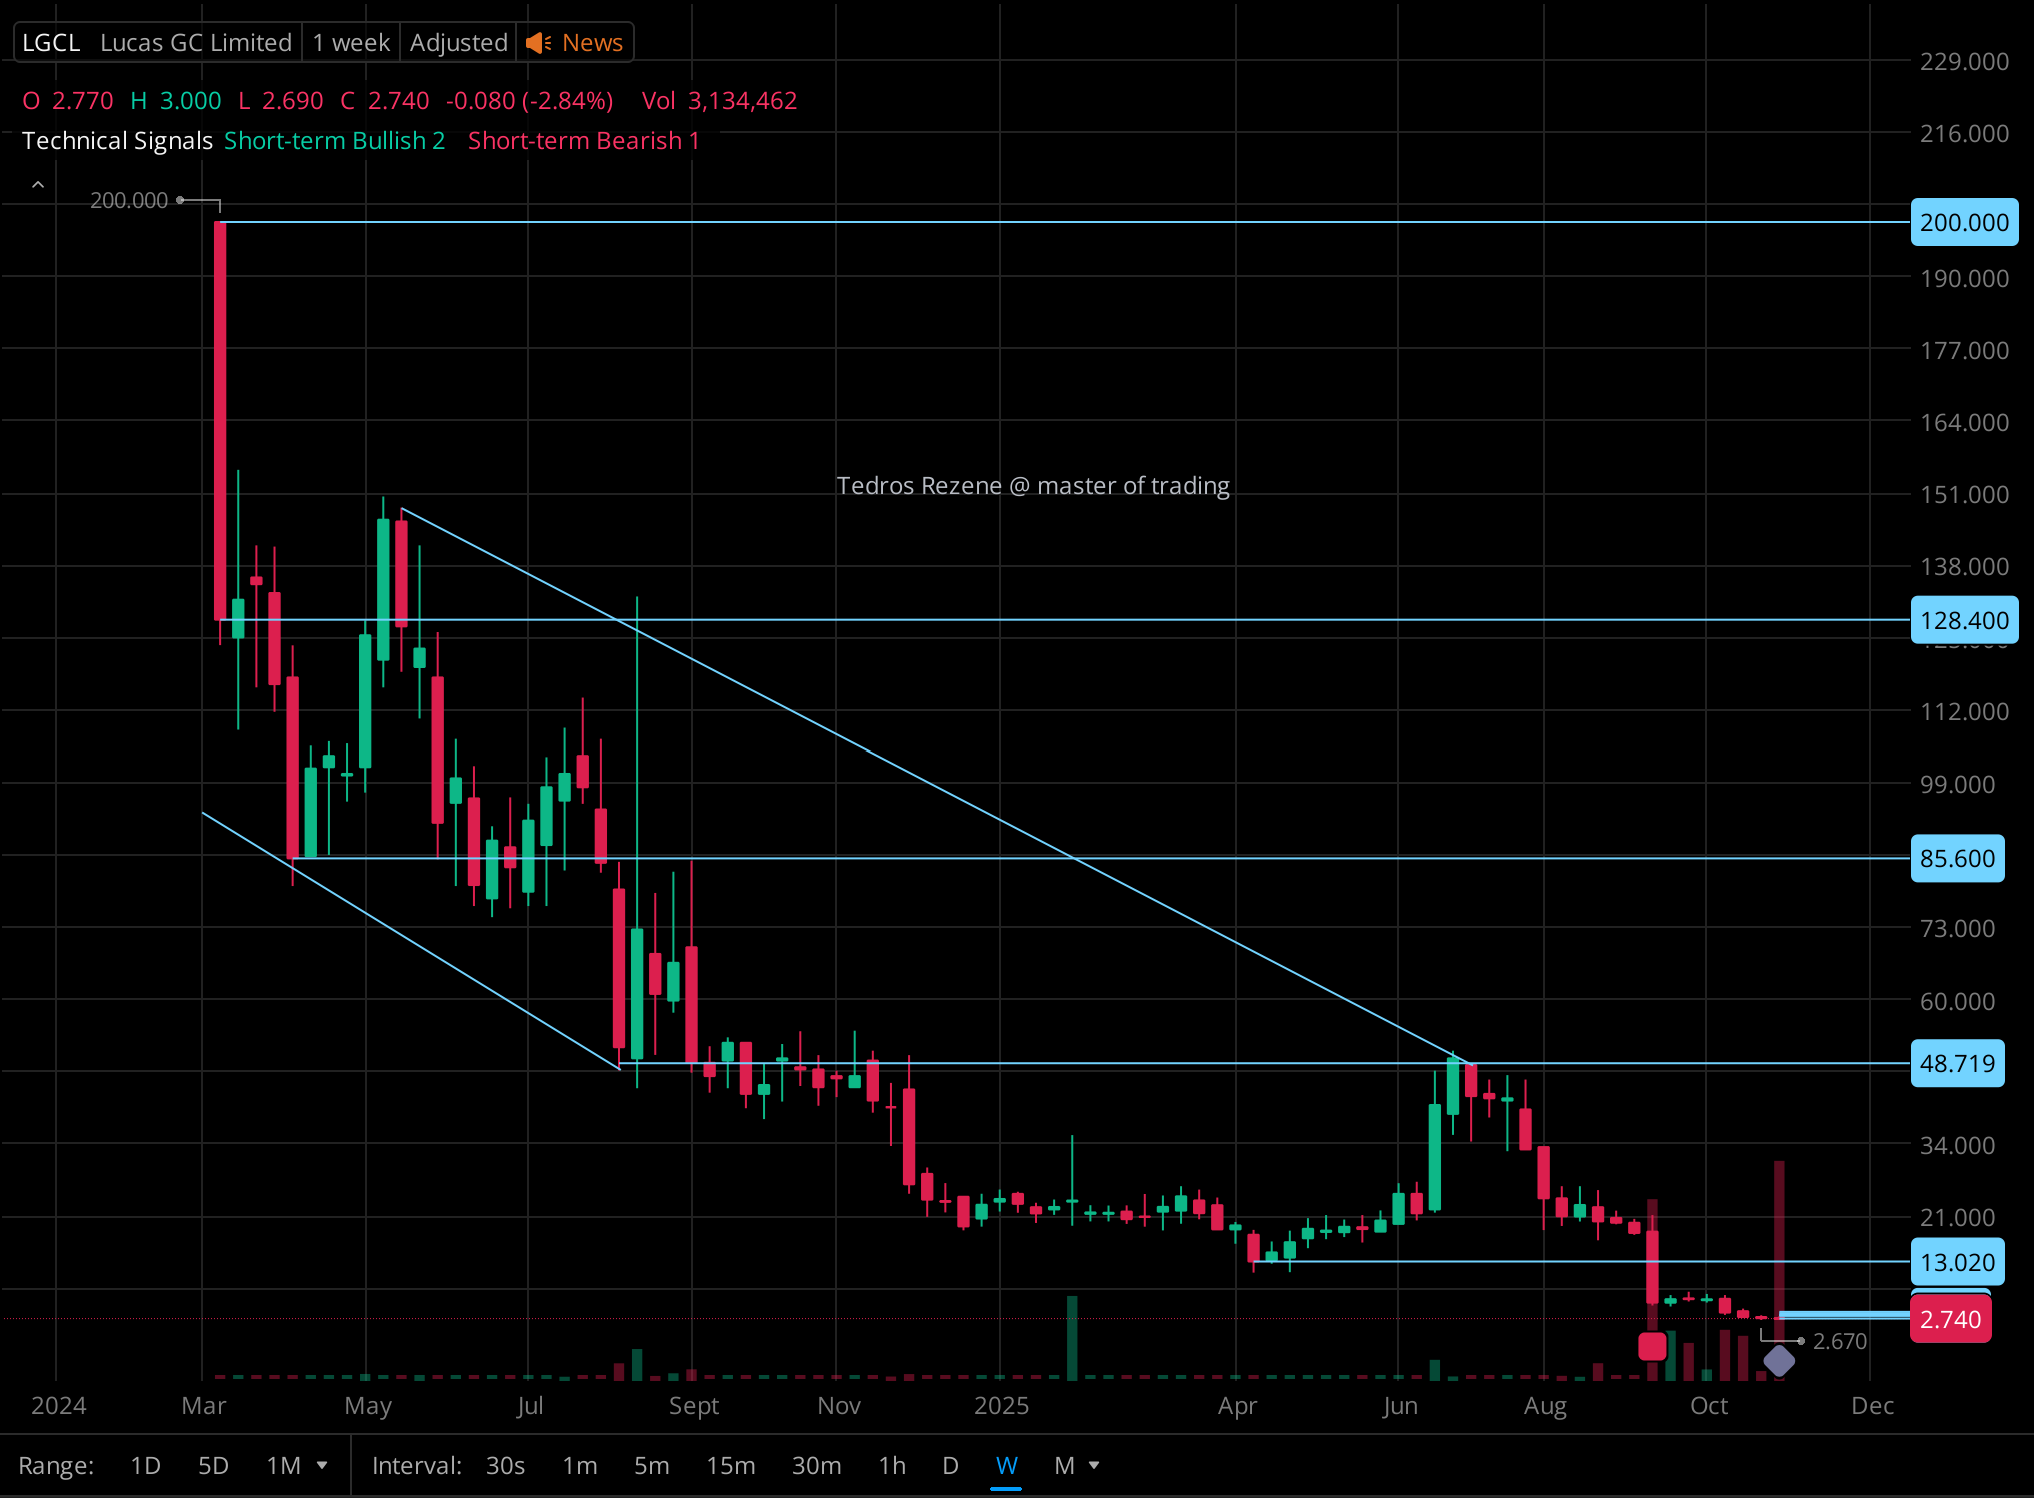
$LGCL
Penny Stock
General Overview
Current Price: $2.74
Recent Change: -2.84%
Volume: 3.13M
Chart Interval: 1 week (longer term trend view)
The chart shows a clear long term downtrend since early 2024, with the stock moving from above $200 down to below $3. Despite that, the technical panel on the right indicates a short term bullish signal, suggesting possible momentum reversal attempts.
Trend Analysis
Downtrend Channel:
The stock has been respecting a descending channel since March 2024. Each rally attempt has failed near the upper trendline.Recent Support: Around $2.50–$2.70, which the price is testing right now.
Resistance Levels:
$13.02 (first significant resistance)
$48.71 (secondary resistance)
$85.60
$128.40
$200.00 (major psychological resistance)
Technical Indicators
From the signal panel:
Short-term KST (Know Sure Thing): Bullish (momentum improving)
Commodity Channel Index (CCI): Multiple bullish readings (both daily and weekly)
Inside Bar (Bullish): Suggests consolidation before a possible breakout.
→ This combination shows bullish momentum building, but still within a dominant bearish structure.
Volume & Candlestick Structure
The recent large volume spikes (especially in October) could imply accumulation or speculative activity near the lows.
Candlesticks around this region show long wicks, suggesting strong buying interest at lower prices.
Interpretation
Short-term outlook (1–4 weeks):
Mildly bullish. Possible bounce toward $5–$6 or even $13 if momentum continues.Mid-term outlook (2–3 months):
Needs a weekly close above $13.02 to confirm a trend reversal.Long-term outlook:
Still bearish until it breaks above the descending channel ($20+).
Key Risks
Low price and volume volatility → potential for pump and dump movements.
Needs strong confirmation of breakout with volume and weekly close above resistance.
Summary
FactorSignalLong term trend BearishShort term momentum Bullish Support $2.50 Resistances $13 → $49 → $85 BiasCautiously Bullish (short term rebound possible).

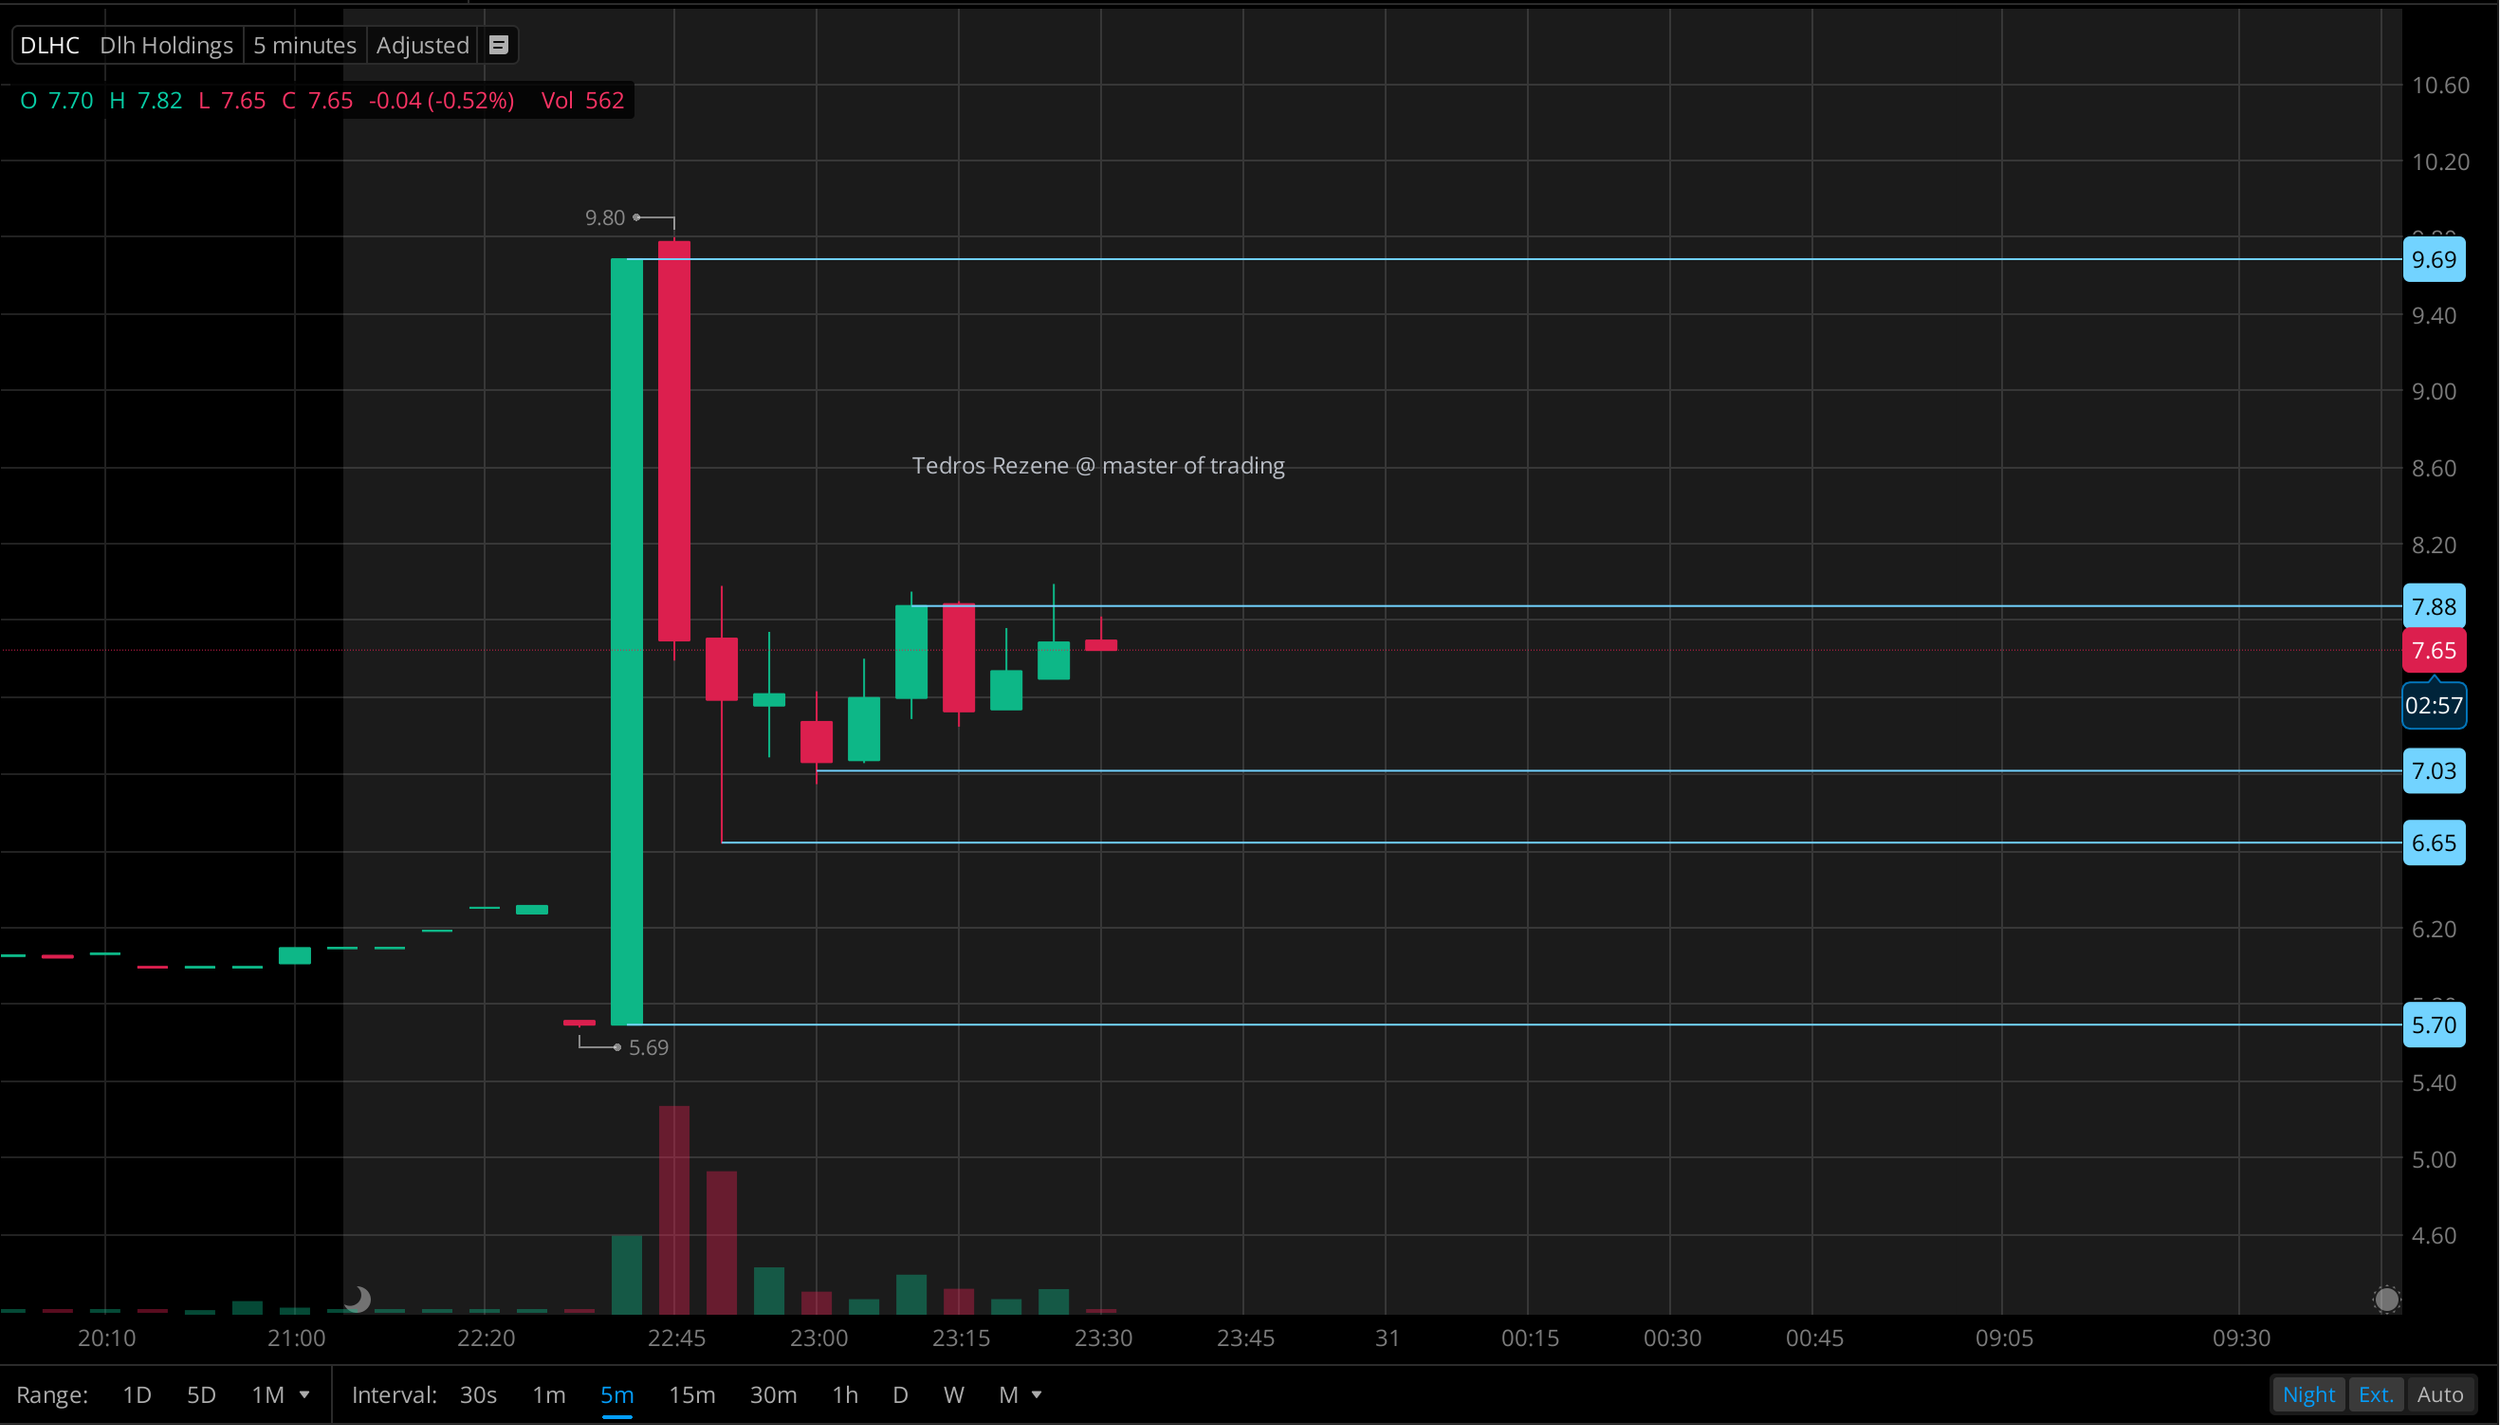
$DLHC 5 Minute Chart Concise Analysis
Current Price: $7.75 USD (+2.79%, +0.21)
Volume: 117,766 (moderate, spike-driven)
Pattern: Vertical pump from $5.69 to $9.80 (72% gain) on massive green candle, then sharp pullback and consolidation $7.50–$7.80.
Support/Resistance:
Resistance: $7.80, $9.69 (prior high)
Support: $7.03, $6.65, $5.70
Momentum: Post spike rejection at $9.80 → distribution; low volume on recovery suggests weak follow-through.
Risk: Classic pump-and-dump setup; high fade potential.
Bearish bias unless reclaims $7.80 with volume. Likely retest $7.03 or lower. Avoid chasing.
Gap fill: price returns to the 28–45 zone and trades inside the empty gap.
Most likely: Dip to 45 (MA9 support) → buy there, not now at 49.90. Gap fill explained:
Price comes back and closes the gap by filling the empty price range (28.16–45).
In INBX: 45 = partial fill + strong support. Full fill only if price drops below 28.16.
Big gap up (28 → 45): News driven breakout.
Small gap down (54 → 49): Profit-taking.
Now@49.90: Above MA9/EMA20 = bullish, but fading volume = wait.
28 USD: Key support/resistance if retested.

Tedros Rezene Master Tip
EMA alignment matters: you’ll want EMA9 to cross EMA20 upward for confirmation of trend reversal.
A double bottom pattern inside $4.75–$5.00 area would strengthen the bullish thesis.
If it gaps up premarket above $5.80, wait for retest before entering to avoid chasing.

Chart Context
Timeframe: 30 min
Price: $5.43
EMA20: $5.73
MA9: $5.63
Support Zone: $4.75 – $5.05
Resistance Zone: $7.30 – $7.38
Buy Zone (Yellow Box Area — $4.75 to $5.05)
This is your high-probability long entry zone.
Volume support and past bounce area make it ideal for a re-entry or fresh position.
Wait for a bullish candle with increasing volume or EMA9 reclaim before buying.
This range offers a risk/reward of 1:4+ if targeting $7.30.
Buy Entry: $4.85 – $5.05
Stop-Loss: $4.70 (below box)
First Target: $5.73 (EMA20 retest)
Final Target: $7.30 – $7.38
Gray Arrow (Mid Target Zone)
If ARTV holds the yellow zone and breaks above $5.73 with strength:
Expect continuation to $6.20 – $6.50, then to $7.30+.
You can trail stop-loss to $5.40 once price closes above EMA20 on good volume.
Red Arrow (Bearish Breakdown Risk)
If $4.75 fails with volume:
Likely retracement toward $3.20 – $2.80 support zone.
That’s your avoid or short-term scalp short zone only if volume spike confirms.
Bullish Candle Vs Bearish Candle
Bullish Candle
Meaning: Price went up during the period.
Structure
Open = bottom of the body
Close = top of the body
Color: Usually green or whiteSignal: Buyers are in control, momentum is upward.
Example: Open at $100, close at $110 → bullish candle.
Bearish Candle
Meaning: Price went down during the period.
Structure:
Open = top of the body
Close = bottom of the body
Color: Usually red or black
Signal: Sellers are in control, momentum is downward.
Example: Open at $110, close at $100 → bearish candle.
🟩 Bullish = buyers winning → price rising
🟥 Bearish = sellers winning → price falling
How to pick profitable stocks
Macro view: Follow economy, interest rates, and hot sectors.
Fundamentals: Choose companies with strong earnings, low debt, and growth potential.
Technical analysis: Use charts (EMA, RSI, MACD) to find the best entry/exit points.
Risk management: Risk only 1–2% per trade, use stop losses, and diversify.
Sentiment & news: Track earnings, analyst ratings, short interest, and market hype.
Good fundamentals + strong chart + smart risk control = consistent profit.
Momentum and Volume
1. Entry: Look for breakouts with strong momentum and rising volume
2. Exit: If momentum fades and volume drops → take profit or reduce exposure.
3. Fake breakouts usually happen when price moves fast (momentum) but volume doesn’t confirm.
Forex vs Stocks
Forex trading profits primarily from macroeconomic trends and leverage using a few currency pairs, while stock trading profits from company growth and dividends across many individual companies, with both relying on technical analysis but vastly different fundamentals.
Many successful traders eventually learn and trade in both markets, as they often present non-correlated opportunities. The key is to start with one, master its unique rhythm and analysis style, and practice extensively with a demo account before risking real capital. There are no easy profits, only well-educated and disciplined ones.
The core principles of technical analysis are identical in both markets. A head and shoulders pattern means the same thing in Apple's stock as it does in the EUR/USD chart.
Thinking one market is a get rich quick scheme is the fastest path to losing money.
To determine the relative strength of one economy against another. If the US economy is strengthening (rising rates, strong GDP) and the EU economy is weakening, you would fundamentally buy USD/EUR.
To find a company that is undervalued by the market and has strong prospects for future growth.
Many successful traders eventually learn and trade in both markets, as they often present non-correlated opportunities. The key is to start with one, master its unique rhythm and analysis style, and practice extensively with a demo account before risking real capital. There are no easy profits, only well educated and disciplined ones.
Penny stocks and Regular stocks
The main differences between penny stocks and regular stocks are:
Penny stocks offer high growth potential but with greater risk; regular stocks provide steadier, lower percentage gains.
Examples of Penny Stocks vs. Regular Stocks
Penny Stock Example:
Company: Theriva Biologics (TOVX)
Price: ~$0.64 (Oct 15, 2025)
Market Cap: ~$6M
Potential: Biotech focus with a $7.00 analyst target (~1,000% upside), but high risk from volatility and unproven drugs.
Regular Stock Example:
Company: Apple Inc. (AAPL)
Price: ~$230 (Oct 15, 2025)
Market Cap: ~$3.5T
Potential: Steady 5-10% annual growth, supported by strong fundamentals, but lower speculative upside.
These illustrate penny stocks high risk/high reward nature versus regular stocks stable, modest returns.
Stock Exchange
A stock exchange is a marketplace for buying/selling stocks. Key U.S. platforms:
NASDAQ: Tech/growth focus, e.g., Apple (AAPL); high liquidity, min $15M market cap.
NYSE: Largest exchange, blue-chip firms, e.g., Coca-Cola (KO); min $40M market cap.
OTC: Decentralized, penny stocks, e.g., Theriva Biologics (TOVX); low regulation, high risk.
Key Differences
Regulation: NASDAQ/NYSE regulated; OTC minimally overseen.
Stock Type: NYSE (large cap), NASDAQ (growth), OTC (micro cap).
Trading: NASDAQ/NYSE centralized; OTC broker driven.