$CCHH
Neutral to Slightly Negative the company is reporting results with a net loss for the first half of 2025 and fulfilling reporting requirements, which aren’t inherently positive catalysts.
$ICON
Negativ
Neutral to slight negative in sentiment it typically signals the company is addressing low share price or reporting compliance, not necessarily strong growth.
$IVF
8-K Negative (short-term).
Neutral at best long-term unless a real catalyst appears.
New CFO = damage control, not growth dilution risk stays, fade the hype until real catalyst.
$LOVA
Iovance issued stock options covering 43,150 shares to four new non executive employees under a NASDAQ inducement rule, aimed at helping the company attract and retain talent as its biotech operations grow.
$RKLB
Rocket Lab ended 2025 on a high note with 21 successful Electron launches, all meeting mission objectives, and reinforced its role as a key launch provider for commercial and government space projects particularly for iQPS’s Earth-imaging satellite constellation.
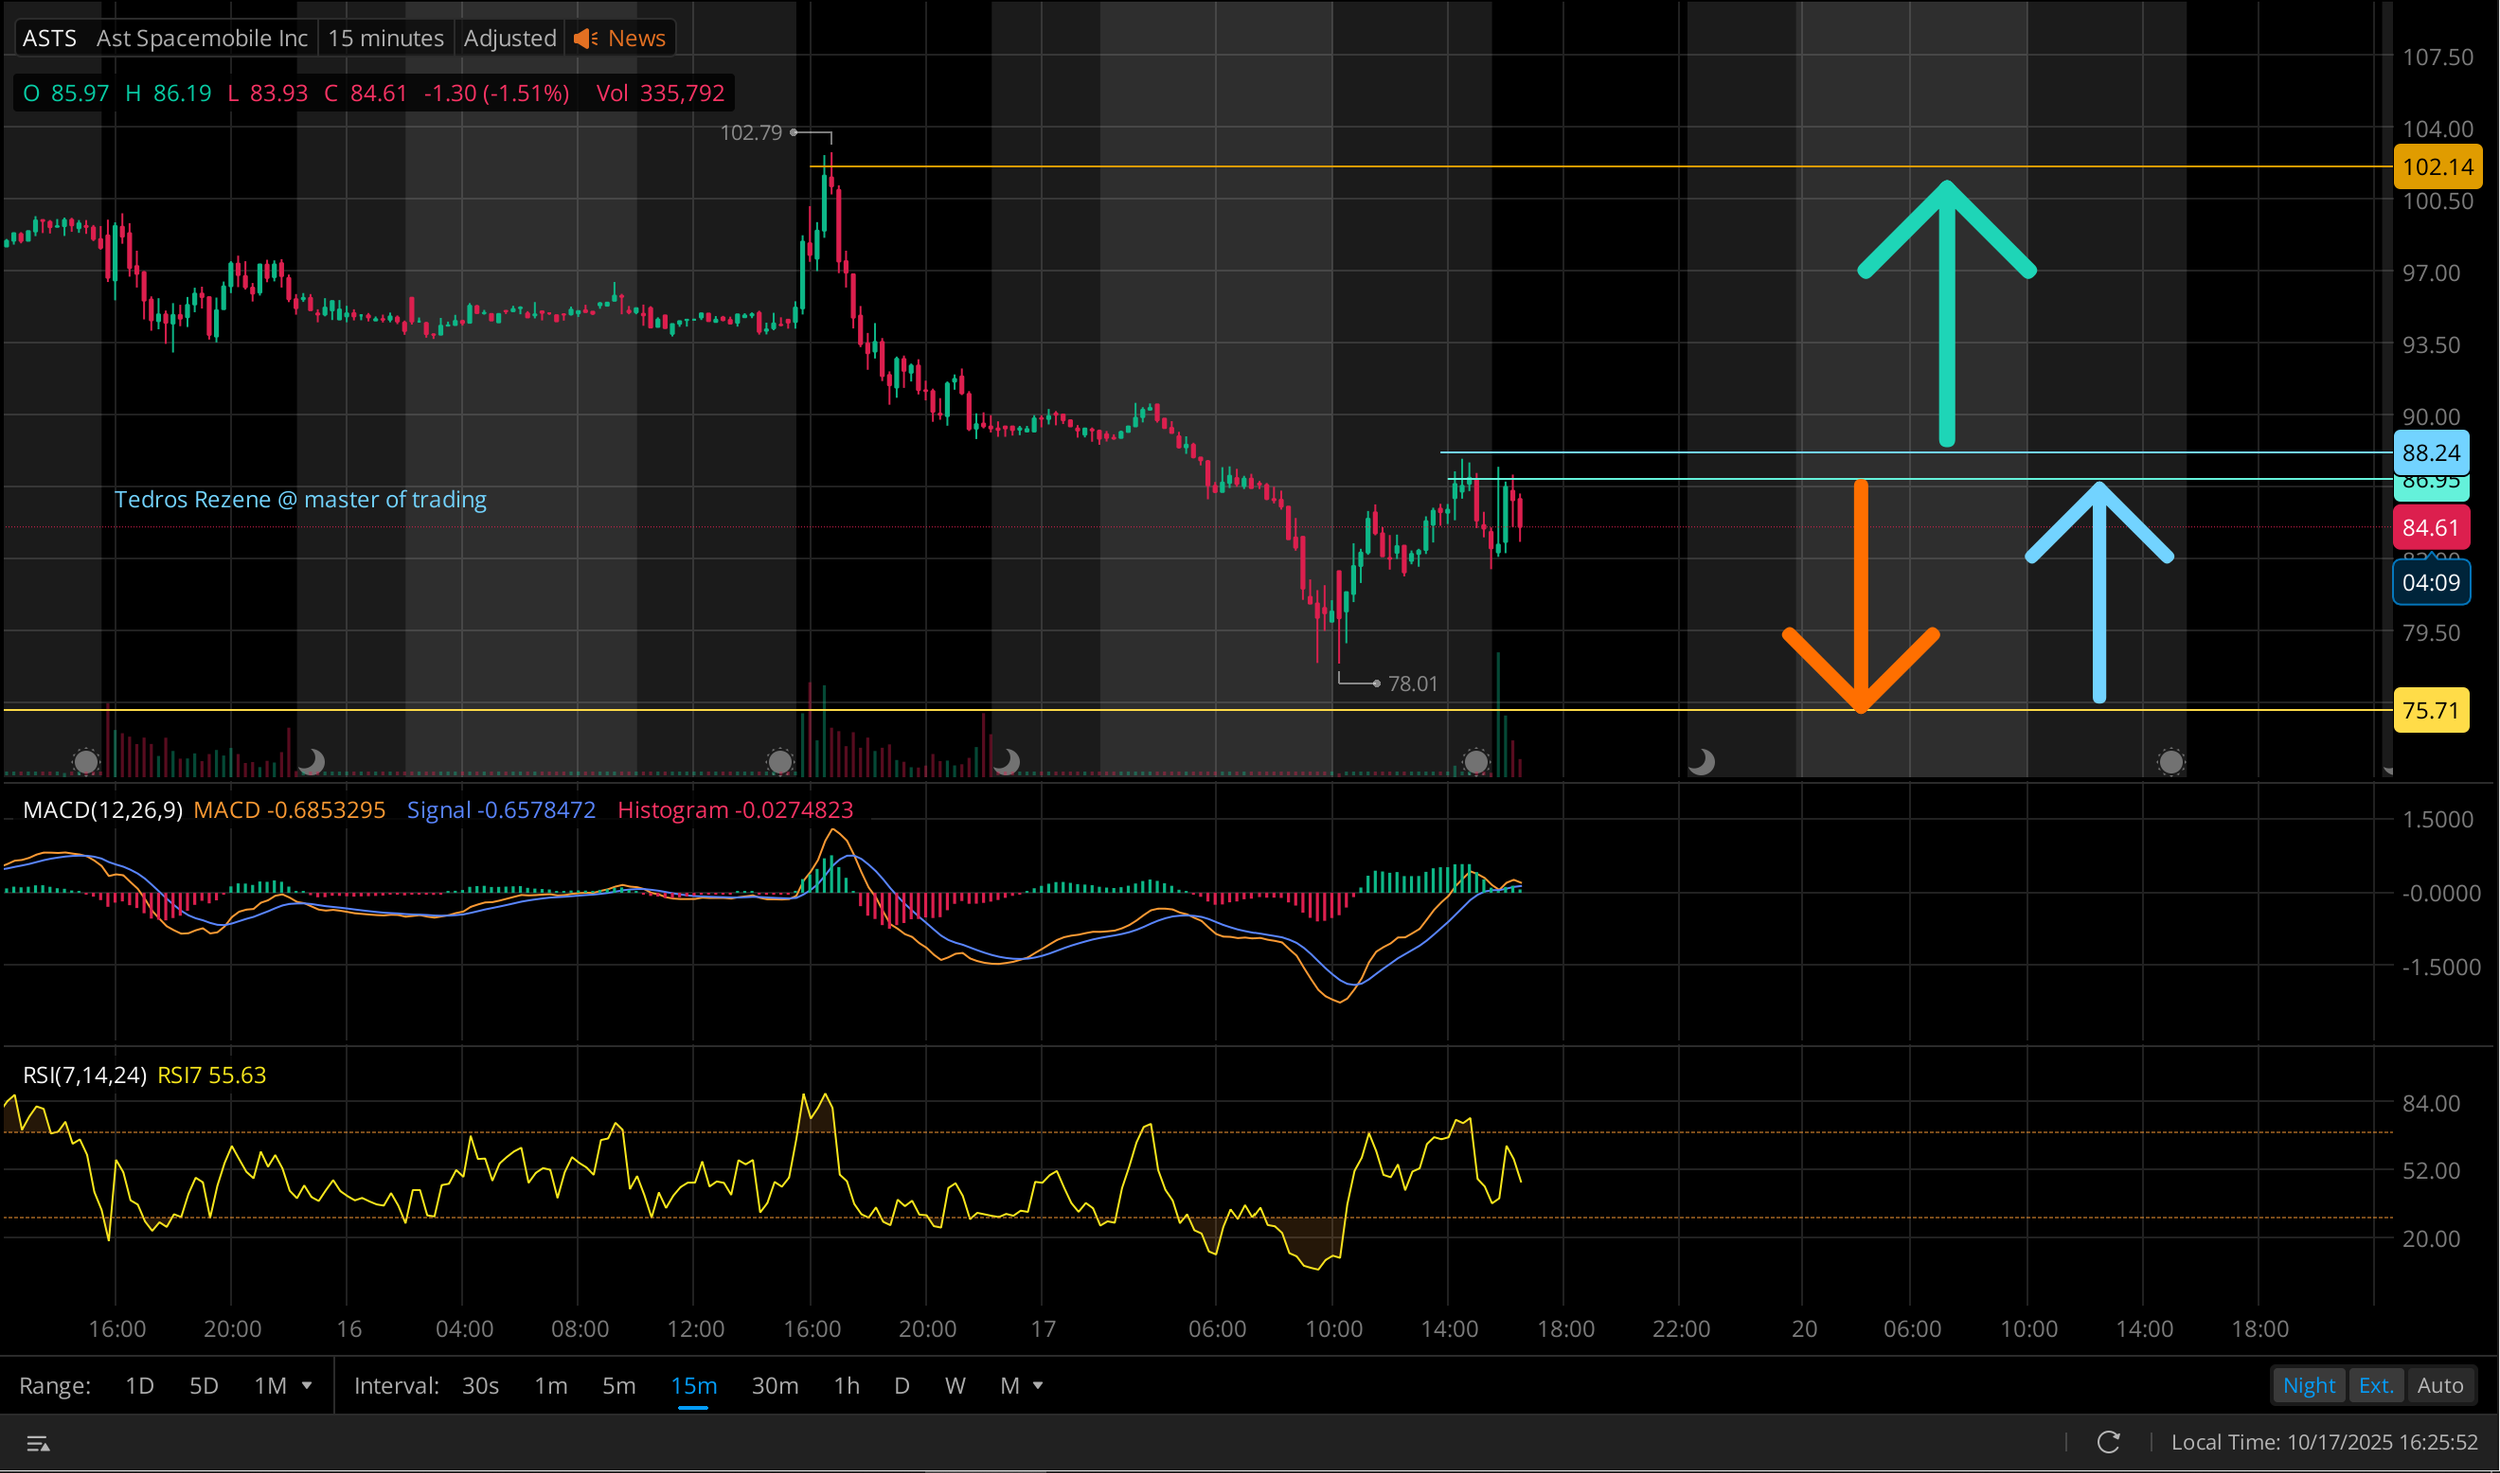
$ASTS
My Analys
Good Buy Entry
Aggressive Entry: Near the current level $85.60, anticipating a bounce from this support area.
Conservative Entry: Wait for a confirmed breakout above $87.11 with strong volume, signaling the short-term downtrend has reversed.
Sell Exit / Stop Loss
Take Profit: Start scaling out of the position in the $93.50 - $97.00 range.
Stop Loss: Place a stop loss at $84.50 or just below. A break below the day's low of $84.65 would be a negative signal, suggesting a retest of lower support levels.
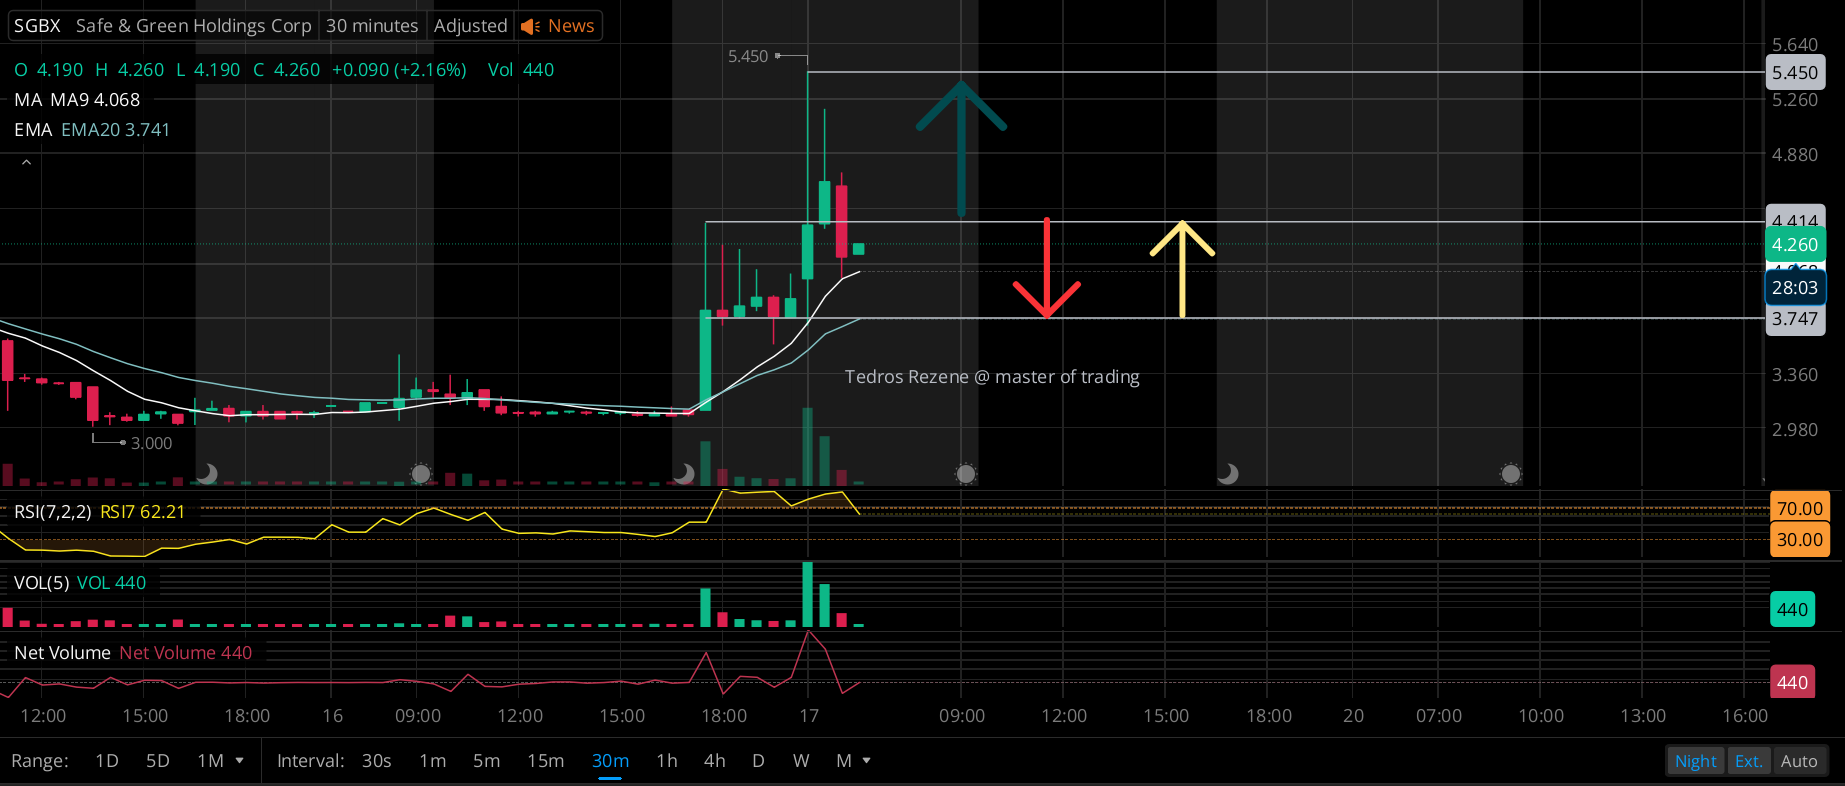
$SGBX
The stock is showing signs of weakness. The price trading below key moving averages and a bearish RSI suggest the potential for further downward movement, possibly testing the support level near the day's low of 4.030 or the longer-term EMA at 3.974. A break above 4.310 would be needed to invalidate this bearish near term view.
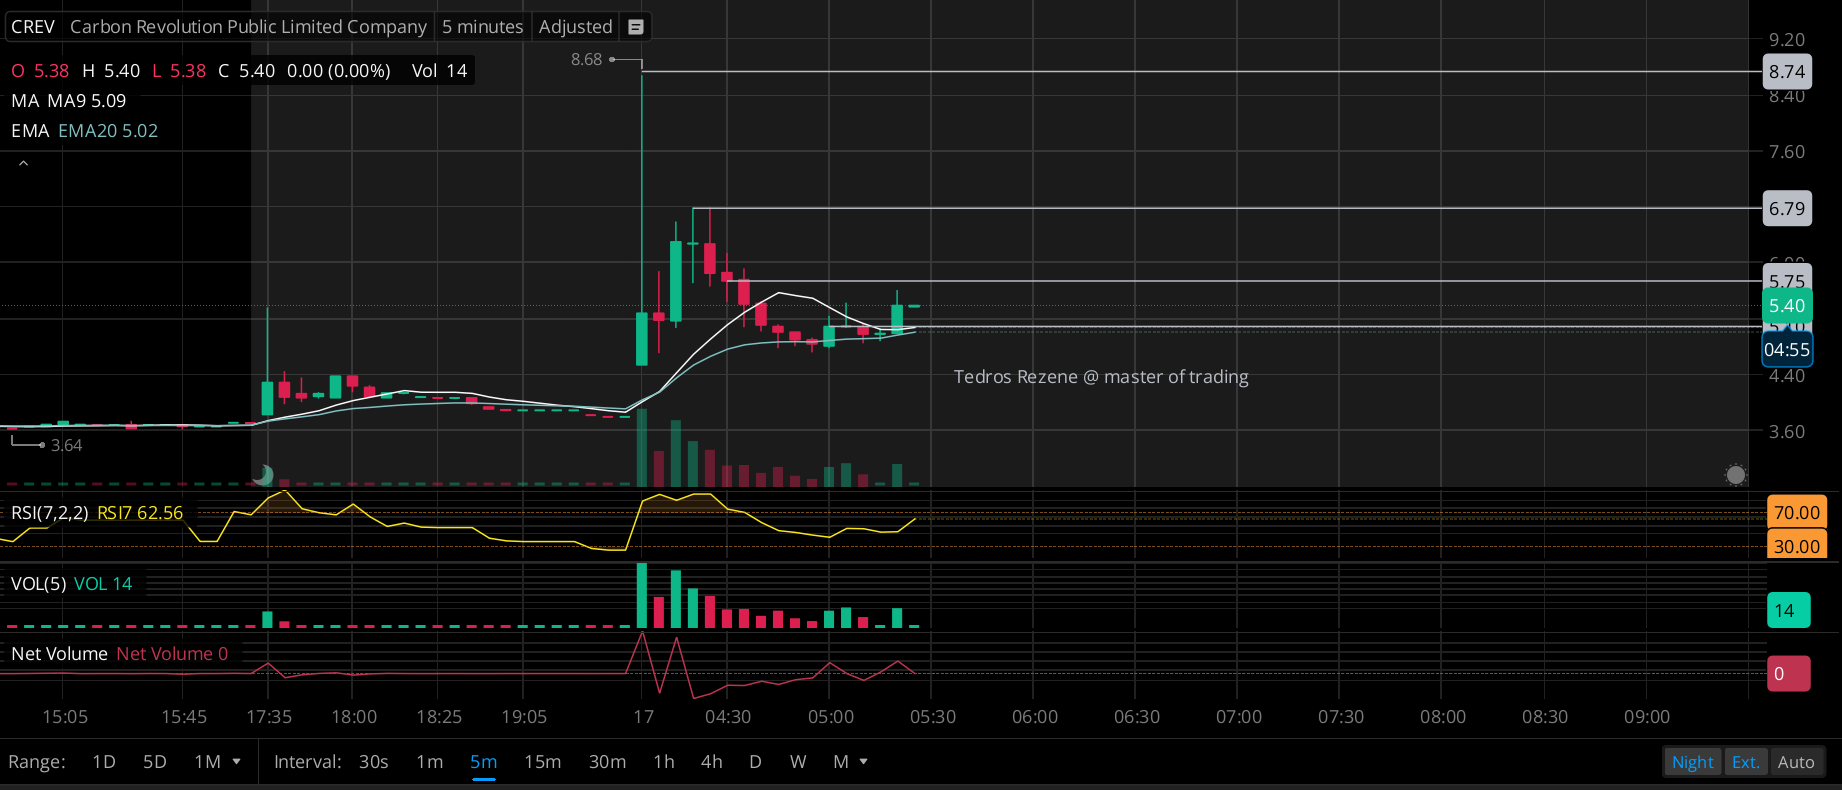
$CREV is consolidating above EMA20 at 5.02 after a strong breakout from 3.64; as long as it holds above 5.00, the next upside targets are 5.75, 6.79, and 8.74 with bullish momentum building.
$ARTV is consolidating above EMA20 after a strong rally; as long as it holds above 5.45, the next targets are 6.39 and 6.85, with a breakout potential toward 7.20–7.35.

Watch out these 8 stocks for the next move..
$AKAN (Akanda Corp): $3.750, +68.16%, Volume: 3.64M, Market Cap: $1.62M
$KZR (Kezar Life Sciences): $6.00, +43.77%, Volume: 1.42M, Market Cap: $30.54M
$KMKR (K-Tech Solutions): $1.860, +28.27%, Volume: 6.67M, Market Cap: $31.18M
$FEMY (Femasys Inc): $0.9590, +28.66%, Volume: 84.35M, Market Cap: $32.06M
$XBP (XBP Global Holdings): $0.5675, +10.67%, Volume: 289.70K, Market Cap: $60.26M
$EGAN (Egain Corp): $15.00, +8.23%, Volume: 437.85K, Market Cap: $372.38M
$THM (International Tower Hill Mines)
$ARTV (Artiva Biotherapeutics): $5.37, +93.90%, Volume: 11.57M, Market Cap: $67.66M
Date: 2025-10-16
$AKAN
The recent surge and high RSI suggest potential short-term bullish momentum, but the overbought condition warns of a possible reversal. No specific price targets are derivable from this chart alone
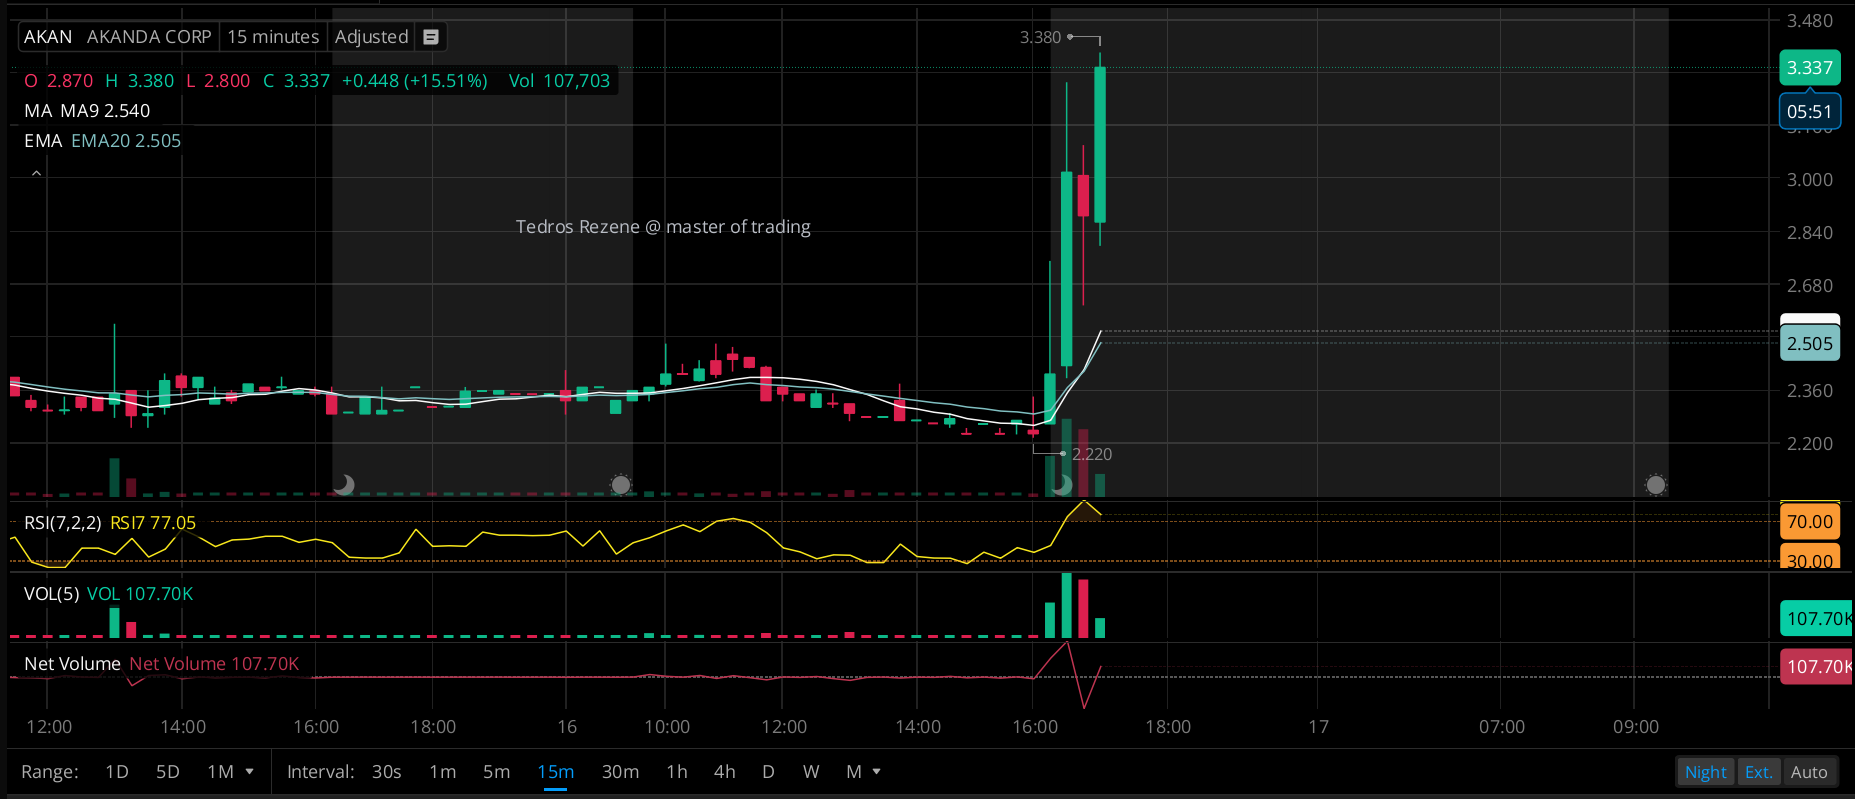
The strong upward move and high RSI suggest short-term bullish momentum, but the overbought RSI warns of a potential pullback.
